


OPTIBOX
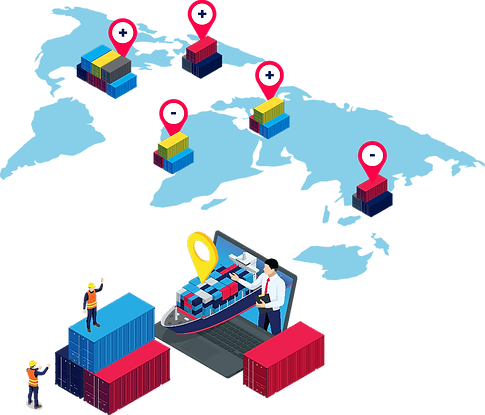
Optibox identifies equipment imbalances globally
and plans equipment re-positioning with minimal
cost and transit times, using Optimization Engines

CURRENT CHALLENGES IN LINER SHIPPING

Carriers can interchange a
significant percentage of empty
containers in all regions
Interchange potential per region as a
percentage of imbalances

HIGH STORAGE COST
due to commercial demands

OPERATIONAL COSTS
constantly increasing
DECLINING REVENUE
week after week

HIGH MAINTENANCE
and repair cost


HIGH CONTAINER STOCK
needed to cater to
geographical needs
OPERATIONAL EFFICIENCIES
impacted due to dynamic
nature of Liner business
VARYING DECISIONS
between purchase, sale,
lease or sub-lease
MT REPOSITIONING IS THE 4TH LARGEST COST
component in the Liner Industry, following Bunker, Terminal, and Charter Hire

WHY YOU NEED AN OPTIMIZED EMPTY
CONTAINER REPOSITIONING PLAN
The need to identify equipment imbalances globally and plan equipment
repositioning is of high value for liner companies because:

OPERATIONAL COSTS
are kept to a minimum

UNUTILIZED SLOTS
identified on vessels between
various port pair legs
TRANSIT TIMES
are catered to

DEMAND FORECAST
supply and demand
conditions at multiple
locations

BUSINESS RULES
adherence to predefined rules
of routing and repositioning

PLANS CREATED
for sale, purchase lease or sub-lease

SEASONALITY
patterns generated using
movement profiles
EQUIPMENT AVAILABILITY
to cater to the best contributing export cargo
ENHANCED CONTAINER UTILIZATION
WITH COST-EFFECTIVE ALTERNATIVES
IMPROVE THE BOTTOM LINE BY EFFECTIVE ASSET
UTILIZATION THROUGH:
-
Automated inventory balancing
-
Alerts & notifications
-
Forecasts generated using time series models
-
Identification of seasonal patterns
-
Identification of volume and freight
-
Solvermind’s AI platform (SEDGE) performing
Data Cleansing, Data Munging, Data Exploration,
Statistical Analysis, Predictive Analytics – Clustering/
Classification/ Regression -
Tracking and tracing in real time
-
Automatic route generation for all port pairs
-
Account management and cost reporting
-
What-if scenarios

ROUTE GENERATION FLOW

DISTANCE
ROUTE FINDER
Identifying the
distance between
two locations

AUTO-ROUTE
CREATION
Connecting with
the nearest inland
location

HUB ROUTE
CREATION
Connecting
with the nearest
seaport
FEEDER
CONTRACT
Identifying the
existing feeder
contracts

HAULAGE
CONTRACT
Identifying the
existing haulage
contracts

ROUTING
MASTER
Identifying the
existing available
routes


FACTORS THAT CONTRIBUTE
TO AN OPTIMIZED SCENARIO
HISTORICAL DATA
N-weeks’ records taken into account (configurable)
Equipment Management System (EMS) Container Routing
Index costs
+
CONSTRAINTS
Port pair quantity
Transit days
Transshipment port
Port rules
Hard rules
Available space in the service
=
OPTIMIZING
Minimize repositioning costs
Container repositioning across the globe
Decision to on/ off-hire/ sale or purchase
Reduce costs for storage, depot services, maintenance & repair
Cater to the best contributing cargo
BENEFITS OF OPTIBOX

Reduce empty
container
storage cost
due to reduced
turnaround time.

Obtain consulting
and advice
on business
processes best
practices.

Gain control over
repositioning
cost.

Improve asset
utilization
by reducing
container idle
time.

Global view of
imbalances &
repositionig plans.

Reduce
maintenance and
repair cost.

FEATURES OF OPTIBOX
IMBALANCE
CALCULATION ENGINE
Auto computes
imbalance based on
real-time container
tracking data.
OPEN
STREET
Calculates equipment
imbalance and geographical
representation for global reposition planning in real time.
COST MATRIX
CALCULATOR
Estimates repositioning
costs in advance for
budgeting and better
cost control. Analyzes
the variances and takes effective & pro-active decisions for future repositioning.
USER-DEFINED
REPOSITION RULES
The user can define
rules based on business requirements.
DEMAND
FORECASTING
Forecasts supply and
demand conditions
at multiple locations
simultaneously by using advanced statistical techniques.